All About Data
MCast runs on data. Data builds our models, powers our forecasts, and drives your business decisions. Learn more about how data is used.
Historical Data
To license MCast, you need two sets of input data: Load Data and Weather Data.
Historical Load Data
We work with you to organize your service territories into Operating Areas. From there, you can collect and send the historical load data required to build models.
What is an Operating Area?
An Operating Area (often shortened to "OpArea" or "op-area") is a natural gas or electric distribution region comprised of a specific set of customers. This region will experience typical growth or decline in customers and energy usage over time. Energy supply for each operating area is typically nominated on a daily basis and the daily and/or hourly forecasts are often the basis for those nominations.
Info
Operating areas don't need to be in different physical locations. We can forecast sales and transportation loads seperately even when they occupy the same geographic area.
Consider smaller operating areas
Individual models for multiple smaller op-areas perform better than one model for a large aggregate op-area. Why?
- Better weather representation over the customer base
- Improved local customer growth modeling
Historical data needed to build models
MCast requires a history of daily or hourly load representing actual consumption.
Best Practice
Models perform best when training on 8-10 years of historical data.
Data can be at the individual gate/meter level or as the total measured load for the entire operating area.
Key considerations:
-
Data must represent actual measured energy.
-
Units must be consistent across all uploads (Dth, Bcf, etc.)
Interruptible Loads
MCast forecasts demand, even during interruptions. If possible, include adjustments for interrupted demand in historical data. If you do not have this data, we can model the interruption if you know the dates of interruption.
Format requirements for historical load data
We require daily or hourly measured load for each operating area. We prefer the data to be in Excel (.xls, .xlsx) or CSV (.csv) files.
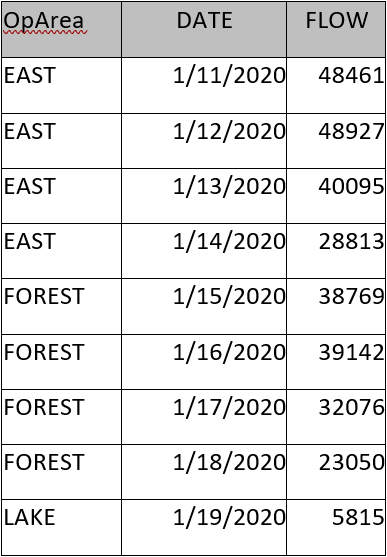
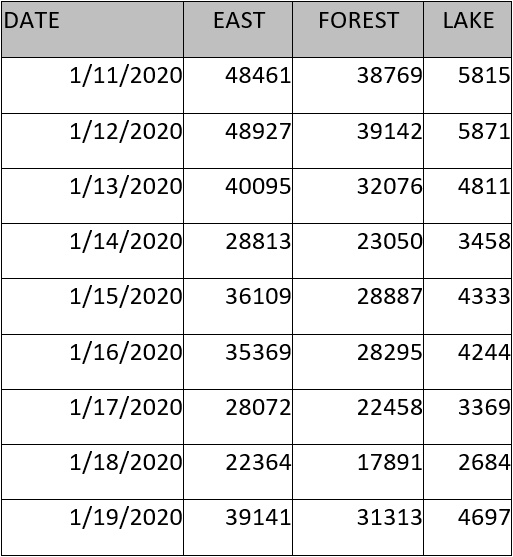
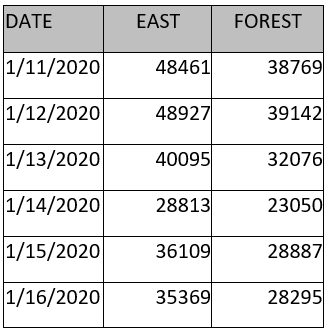
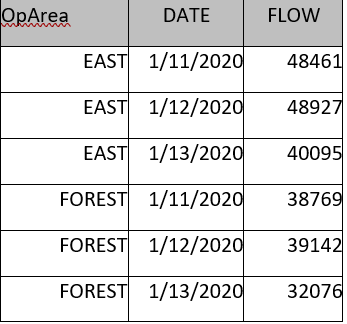
The following are common ways files are formatted:
If you have another file format, send us a sample and we will let you know if it meets our requirements.
Note on Column Headers
Column headers do not have to match the ones aboves, but each column header should be unique in the file.
Note on Hourly Load
For files representing hourly load, the date and hour can be either in one column or two separate columns.
Historical Weather Data
MCast requires observed weather data to build models. To run models on an ongoing basis, MCast needs hourly forecasted and observed weather data.
We will help find and source historical observed weather data through NOAA. If you have other data you would like us to use, please let us know.
We will also help you determine the optimal combination of stations using a process called Weather Station Optimization
Ongoing Load Data
The best way to improve forecast accuracy is by uploading timely and consistent load data. MCast supports automated uploads of observed load values for daily and hourly forecasting.
Data submission can occur through:
File Setup Requirements
The acceptable file types for ongoing load data updates are .csv, .xlsx, or .txt.
Best Practice
Use file names containing a date stamp. For example, <yyyymmdd>_load.csv where <yyyymmdd> is the date that the file was generated.
Your files must adhere to one of the following layouts:
Date per row
In this format, each row represents one date/hour. Multiple operating areas are represented as seperate columns.
Record per row
In this format, each row contains a single flow value, specific to one operating area and one date/hour.
Best Practice
Include a few previous days and/or hours of load data. This helps in the event a forecast run is missed or there is input data that needs to be corrected.
Additional Hourly Load File Requirements
Hourly load files have the some additional requirements for their files
- The date and hour can be either in one column or two separate columns
-
You must communicate if your file "Hour Beginning" or "Hour Ending"
Example
Hour Beginning: '7:00' = data measured between 7:00 - 8:00 Hour Ending: '7:00' = data measured between 7:00-8:00
-
You must communicate if your file is in "Clock Time" or "Standard Time". Incorrect configuration can severly impact forecast accuracy. See Reporting your data for Daylight Savings Time.
- The date and hour can be either in one column or two separate columns
-
You must communicate if your file is configured to log data as "Hour Beginning" (meaning the hour listed is at the start of the collection period), or "Hour Ending" (meaning the hour listed is at the end of the collection period)
Example
An "Hour Beginning" file that has an entry for 7:00 indicates that the value was measured from 7:00 - 7:59. An "Hour Ending" file that has an entry for 7:00 means that the value was measured from 6:00-6:59.
-
You must format your file to be in either "Clock Time" or "Standard Time" (see the warning below for more)
Warning
An hourly load file MUST be properly formatted as "Clock Time" or as "Standard Time" in order to ensure that your data is correctly read-in to the product. An hourly load file incorrectly configured for Clock Time when the data corresponds to Standard Time (or vice versa) can lead to the hourly load being read in for the wrong hour. This can have substantial effects on forecast accuracy. For more information on Clock Time and Standard time, read the section Reporting your data for Daylight Savings Time
Corrections and Updates
You may need to update data outside of your normal process. In those cases, you have a few options.
Through Normal Processes
Send an updated file or create a new API call to seemlessly update the data in MCast. MCast will rerun the latest forecast with the updated data
Warning
Data older than 14 days ago is not used as a direct input into the model. If you need to regenerate forecasts based on data older than 14 days, reach out to support@marquetteenergyanalytics.com
Web Interface Corrections
You can use the Correct Load Values feature on the website to manuualy correct load data.
Note
"Manual Entry" users, will see this as "Manually Enter Values" on their website.
Locking In Values
Using the lock icon on the form, will ensure that the entered value overwrites any future data uploads. This can be helpful when automated processes send incorrect values multiple times.
Monthly Updates
If you have regular large data updates, you have two options:
- Use the API to upload the larget dataset
- Create a new file for regular large updates. This file can have a different name and format from your ongoing daily file.
Note
MCast supports file uploads of up to 60 days. For larger updates, contact support@marquetteenergyanalytics.com
Updates for Model Training
Once a year, we train new models for all daily customers. As part of this process, you will receive an email from the MCast team asking for any notable data updates. Please send this data in one of the acceptable formats for historical operating area data.
Houly models get updated on a quarterly basis. Because of this increased frequency, we do not request data updates. Someone from the MCast team will reach out if they have any questions about the data or need additional information.
Other Non-Standard Updates
If you have a large, non-standard data update, please reach out to support@marquetteenergyanalytics.com.
Input Data Webinar
Watch our team explain load data, corrections, and upload options:
- 0:00 - Introductions
- 1:38 - Input data
- 3:33 - Weather and load data overview
- 7:43 - Uploading via the SFTP site
- 10:39 - Manually entering load data
- 14:06 - Once a month update files
- 15:14 - Correcting input data
- 16:28 - Correct it in the file
- 17:40 - Correct it on the MCast website
- 22:04 - Correct it through a once-a-month update file
Ongoing Weather Data
Weather data is a required input to MCast. When any of our load forecasting products are run, they read in the most recently available weather forecasts and observations.
All weather stations must have hourly weather forecasts and observations in order to be used as an input to MCast.
There are two options for getting this weather data into the product:
- Sourcing through our preferred weather vendor, AccuWeather for Business
- Providing weather data to us through a weather vendor or meteorology department
AccuWeather for Business - our preferred weather vendor
We are proud to partner with AccuWeather for Business (AFB) to provide forecasted and observed weather data to MCast customers at a special discounted rate! Years of collaboration have resulted in an efficient, reliable, and automated data transfer pipeline between the AccuWeather for Business system and MCast. By utilizing AFB's XML Query Tool, MCast can make API calls to receive all needed data automatically, removing the need for any flat file transfers or manual weather data intake.
Additional advantages to choosing AccuWeather for Business:
- AFB licensing costs can be included in your MCast invoice for easy billing
- Your organization can use AccuWeather for Business weather data in any other systems that utilize weather. We'd be happy to discuss what your organization's weather data needs are and how best to meet them.
If you're ready to further automate your forecasting process with AccuWeather for Business, send us an email at info@marquetteenergyanalytics.com
Required Weather Instruments
MCast requires hourly weather data for a number of weather instruments, depending on which product you license.
The following table lists all of the weather instrument requirements for the 3 types of load forecasting products.
| Weather Instrument | Daily | Hourly Gas | Hourly Electric |
|---|---|---|---|
| Temperature (TEMP) | YES | YES | YES |
| Wind Speed (WIND) | YES | YES | YES |
| Dew Point (DPT) | YES | ||
| Global Horizontal Irradiance (GHI) | YES | ||
| Wet Bulb Temperature (WET) | YES |
Weather File Requirements
Info
You can upload either a single file containing all weather station data or a different file for each weather station's data.
Info
You can include observed and forecasted data in the same file, or you can split them into separate files.
- File(s) must be retrievable via either SFTP or FTP
- File(s) must be in
.csvor.txtformat - The filenames must be consitent
- We recommend something like \<yyyyMMdd>_weather.txt where \<yyyyMMdd> is the date that the file was generated.
- Any and all missing observed weather reads must be patched with estimated values
- File(s) must contain at least 1 day's worth of retrospective data, but we recommend including a full week
Warning
We can accept files with less than 8 days of weather forecasts, but this will limit how far out the load forecasting models can go.
(For example: if your weather files only go out 5 days, MCast's models can only forecast the load out 5 days)
API Option
When possible, our team prefers to load data via APIs rather than through flat file transfer. If you are able to provide access to your weather data via API calls, let us know! We'd love to evaluate your API to see if we can easily integrate it with our systems.
Accessing Your Data
The Downloads Tab
You can access, configure, and download all analysis files via the "Downloads" button on the right side of the header. Note that the contents of the "Downloads" tab will be different depending on what page of the website you are on (for example, if you are on the "Daily" page, then the downloads will only pertain to the data related to your daily forecasts; if you are on the "Hourly" page, then the downloads will only pertain to data related to your hourly forecasts.)
Current Forecast
What is the Current Forecast file?
Users can download the output file for the currently-displayed forecast here. If you wish to modify the file contents and organization of the output file that you download, you can make those edits here using the "Advanced Settings" section.
Note
Modifications to the file contents from the Current Forecast panel will NOT modify the file contents of any output files you receive automatically after a forecast completes. To modify those file configurations, you must go to the "Configuration" section of the "Settings" tab.
Current Forecast Weather
What is the Current Forecast Weather file?
Users can download the weather data used in the currently-displayed forecast here. If you wish to modify the file contents and organization of the weather file that you download, you can make those edits here using the "Advanced Settings" section.
Note
Modifications to the file contents from the Current Forecast Weather interface will NOT modify the file contents of any weather file(s) you receive automatically after a forecast completes. To modify those file configurations, you must go to the "Configuration" section of the "Settings" tab.
Daily Model Performance
What is the Daily Model Performance file?
This allows you to compare forecasted and observed values for each day and intraday period. Each row represents a GasDay forecast for the day and intraday period given, and includes the forecasted weather that was used in that forecast. Each row also includes the observed load and weather for comparison. Only one forecasted value is displayed from each forecast, and it is set to be a specific number of days (horizons) out.
- By default the "Day Number" is set to be 0, meaning it is the forecast 0 days out.
- If the file were to be set to "Day Number" = 1, then for each date in the file it will find the GasDay forecast generated when that date was 1 day out.
- These day numbers from 0 to 7 correspond with the day numbers found along the top of the summary table on the Daily page.
Under "Advanced Settings", you can select the days out (or "Day Number") that you wish to be in the file, the forecasts you wish to include in the file, which columns you wish to be included in the file, and you can transpose the data within the file.
This download will only show up if you license a daily forecasting product.
Hourly Model Performance
What is the Hourly Model Performance file?
This allows you to compare hourly forecasted values to the observations on a rolling window. Each row represents an hourly forecast and includes the forecasted weather that was used in that forecast, as well as the observations for that hour. The rolling window is set to be some number of hours out from the forecast time.
- By default the "Hour Number" is set to be 0, meaning it is the forecast 0 hours out.
- If you set the "Hour Number" = 4, then the forecast is 4 hours out. In the file, this would mean that the 10:00 AM observed data will be compared to the forecast made at 6:00 AM for 10:00 AM, the 11:00 AM observed data will be compared to the forecast made at 7:00 AM for 11:00 AM, and so forth.
For this analysis to generate a full data set, you must run your model every hour. If you don't run every hour, there will be missing data in this file.
Under "Advanced Settings", you can select the hours out (or "Hour Number"), that you wish to be in the file, which columns you wish to be included in the file, and you can transpose the data within the file.
This download will only show up if you license an hourly forecasting product.
Hourly Perfect Weather
What is the Hourly Perfect Weather file?
This allows you to re-generate a full hourly forecast using only observed weather data. Using only observed (or "perfect") weather removes any forecasting errors that resulted from inaccurate weather forecasts, so that the only error remaining would be reflective of modeling error only.
The date you choose will be used as the "Day 0" of the Perfect Weather forecast that is created when clicking "Download CSV."
You may generate an Hourly Perfect Weather forecast for any date in the past on which you have observed weather.
This download will only show up if you license an hourly forecasting product.
Normal Weather
What is the Normal Weather file?
This allows you to download the normal temperature for the calendar year, either by weather station or operating area.
By default, normal temperature values are generated relative to 30-year normals, and they are regenerated each time you are given a new model update. Speak to your support specialist if you would like this changed at all to fit your company's needs.
Weather Station Weights
What is the Weather Station Weights file?
This allows you to view the weather station weights used in the current forecast. The weather station weights are used to determine how much each weather station contributes to the final weather value for each operating area. The weights downloaded in this file can be converted to percentages by multiplying each value by 100.
See the Frequently Asked Questions section titled "What is a Weather Station Optimization" for more information on how these weights are determined.
Planner Daily Probability Scenarios
What is the Planner Daily Probability Scenarios file?
This allows you to view the MCast Planner estimates for the average, lowest and highest daily loads for a variety of scenarios for a range of months.
These scenarios are reported in terms of percent chance and 1-in-N-years and reflect the probability of the "total load" for the time period. For instance, if you select "20% chance" or "1-in-5" while the month selected is "February", then "Cold 20% Chance" is the average daily load of a February scenario with a total load that there is a "20% chance" of exceeding, while "Warm 20% Chance" is the average daily load of a February scenario with a total load that there is an "80% chance" of exceeding. Likewise, "Expected" is the average daily load of a February scenario with a total load that there is a "50% chance" of exceeding.
Note
Whether these probabilities are displayed in percent chance notation or 1-in-N notation is determined by clicking the settings gear on the MCast Planner page.
This download will only show up if you license Planner.
Planner Monthly Probability Scenarios
What is the Planner Monthly Probability Scenarios file?
This allows you to view the MCast Planner estimates for the monthly total demand probabilities for a range of months.
These probabilities are reported in terms of percent chance and 1-in-N-years. For instance, "Cold 20% Chance" or "Cold 1-in-5" refers to a monthly total load that there is a 20% chance of exceeding, while "Warm 20% Chance" or "Warm 1-in-5" refers to a monthly total load that there is an 80% chance of exceeding.
Note
Whether these probabilities are displayed in percent chance notation or 1-in-N notation is determined by clicking the settings gear on the MCast Planner page.
This download will only show up if you license Planner.
Planner Daily Extremes
What is the Planner Daily Extremes file?
This allows you to view the MCast™ Planner estimates for the average, lowest and highest daily loads for a variety of scenarios for a range of months.
These scenarios are reported in terms of 1-in-N-years and reflect the probability of any individual day's load for the time period. For instance, if you select "1-in-5" while the month selected is "February", then "Cold 1-in-5 Chance" is the daily load of an individual February day that would be expected to be colder once in 5 years, while "Warm 1-in-5 Chance" is the daily load of an individual February day that would be expected to be warmer once every 5 years.
Note
These probabilities are displayed only in 1-in-N notation regardless of what is selected in the settings gear on the MCast™ Planner page.
This download will only show up if you license Planner.
The MCast™ API
An Application Programming Interface (or "API") is a way for software to talk to other software. An API defines a common language to share information between different applications.
MCast has its own secure API that defines how other software can get data from and post data to the application.
APIs are often used by IT and software developers to integrate different processes and services. At Marquette Energy Analytis, we try to perform data transfers using APIs whenever possible (such as when loading Weather Data into MCast). To ensure the integrity and confidentiality of your data, our REST APIs are secured with industry-standard authentication mechanisms. We continuously monitor and update our API security to safeguard against unauthorized access and potential vulnerabilities.
If you are working on any new automation or improvements to old processes, let your IT support contact know that MCast provides an API for them to utilize!
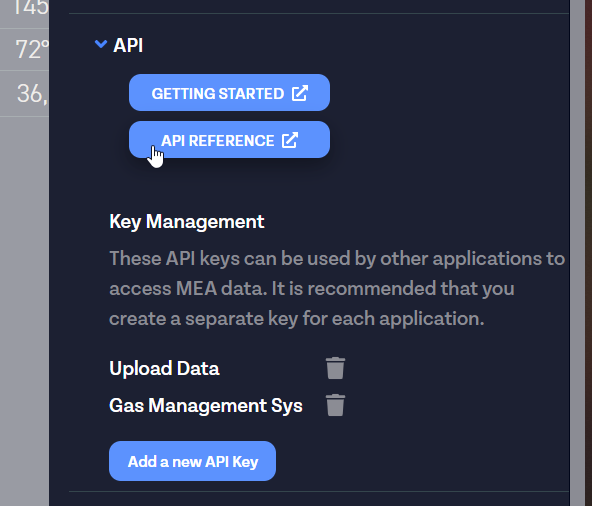
Getting Started with the MCast API
Before you can use any of the functionality in the API, you'll first need an API key for authentication. An Admin or User of MCast can easily generate an API key within the MCast website in the Settings menu.
Treat this API key the same as you would a password to a website. It grants a user full access to see all of your data, to upload new data, and to generate new forecasts all using the API. Best practice when authenticating with API keys is to create a new API key for each application that would use the API instead of having just a single API for your entire company. This way it's easy to track what the API is being used for in your organization, as well as to revoke access to a single application using the API without having to change the key in all other applications.
Once you have an API key setup, you can start accessing the API via HTTPS requests. You can see the full API Reference documentation on the different API functionality available through your MCast web portal, by clicking on the "API Reference" button in the same menu you used to generate an API key.
Within the API documentation, you can click the "Authorize" button and paste your API key in the popup window to enable trying out API requests without leaving the documentation page. Each API endpoint has a "Try it out" button that will let you enter your own parameters and see what the API returns. Use this to quickly develop your HTTPS requests prior to writing the code to do it.
Warning
This runs real requests against your live MCast instance, so make sure you set the dryRun parameter to true on any requests that upload data or run a forecast. If dryRun is set to false, then your API request will execute on your production database.
If you want to write as little code as possible when working with the API, you can copy-paste from our code samples below, or you can try out the Postman API Client. Postman is an application that lets you try out API requests similar to the MCast API documentation page, but will also output code to run that request in many different programming languages.
What can I use the MCast API for?
The MCast API allows you to integrate the MCast forecasting platform with other applications and automated processes within your organization. There are three main uses of the MCast API:
Accessing data
Through the MCast API you can access load forecasts that MCast produces, load observations that your company uploads to us, and weather data that is used when generating forecasts.
Uploading load data
You can use the API to upload a data file that was configured by your MEA support specialist, or you can upload a formatted JSON containing your load data. Jump to the Ongoing Load Data section for more.
You can also use the API to make corrections to data you've previously sent to MCast. Jump to the section Correcting data through normal SFTP or API routes for more.
Generating an MCast forecast
You can use the API to launch a new MCast forecast, either after uploading formatted JSON load data, or after your weather provider has made new weather forecasts available. See the Generating Demand Forecasts section for more.
Note
If you have a file "watcher" set up that triggers a forecast upon upload of a file, that will still work if you upload a file via the API.
If you don't know what a file "watcher" is, see the information listed under "SFTP File Transfer" in the section Generating Demand Forecasts.
Some more specific examples of how you might utilize the MCast API:
- Import MCast data into your own flow management system
- Send MEA automated data updates as new data becomes available
- Run your own analytics on MCast data
- Schedule MCast to run at times when new weather forecasts become available
Samples
Check our API samples repository for examples of using our API in any of the following languages:
API Intro Webinar for Developers
Hear our team talk through the MCast API - including a couple of code-heavy examples of using the API - in the video below!
- 0:00 - Introductions,
- 1:10 - What is an API
- 6:19 - Documentation on the MCast API
- 9:55 - Demo: Using the API with PowerShell
- 24:02 - Demo: Power BI (using C#)
- 56:52 - How to find the API Documentation used in the demo
API "Low-Code" Example with Power Query M
Hear our team talk through using Microsoft Excel's built-in query language, Power Query M, to quickly generate an API call and load it into Excel in the video below!
Recorded on 8/15/2023
- 0:00 - Overview and setup
- 0:35 - Generating an API Key
- 1:38 - Accessing the Help documentation
- 2:16 - Querying in Excel
API "No-Code" examples for Excel and Power BI
Hear our team talk through a detailed, no-code use case for the MCast API. The goal of this talk was to build dynamic API calls for loading data into Microsoft Excel and Power BI without writing a single line of code.
- 0:00 - Presentation overview and goals
- 1:00 - Demo: Setting up your API
- 11:25 - Demo: API calls in Excel
- 37:54 - Demo:: API calls in Power BI
MCast SFTP site
SFTP stands for SSH File Transfer Protocol, which is a network protocol that is commonly used for file transfers. Transferring files through SFTP is a secure, encrypted way to transfer data between your company and Marquette Energy Analytics.
MCast uses SFTP to collect new ongoing load data before generating a load forecast. You can transfer load data by uploading files to the Marquette Energy Analytics SFTP site set up for your web instance. Your instance can be configured to automatically generate a forecast whenever you upload a file.
You can also use the SFTP site to make corrections to data you've previously sent to MCast. Jump to the section Correcting data through normal SFTP or API routes for more.
Your SFTP site can also be configured to receive ongoing weather data, if it is not provided on a third-party site.
MCast also uploads data to the SFTP site. At the end of each forecast generation, any output CSV files you have enabled will be uploaded to a folder on the SFTP server called “output.”
Connecting to your MCast SFTP Site
There are multiple ways to connect to your SFTP site.
Manually Connecting: The most common way individuals connect to the site is through an SFTP client. Software such as Filezilla and WinSCP are popular, easy-to-use clients to connect to SFTP. Due to the increased security inherent in SFTP, you will not be able to connect to an SFTP site through your file explorer or an internet browser.
Through Automation/Scripts: For daily operations, most companies prefer to script a process that automatically uploads and/or downloads the needed files. Most scripting languages have extensive SFTP libraries to connect through. When using a script to connect and upload to the SFTP site, it is important to ensure that preserving timestamps are disabled. The tool MCast uses to start a new forecast relies on the file's timestamps matching the time the file was uploaded.
If you need credentials or are having connection issues with the SFTP site, see this section about accessing the SFTP site.
Running Tests to Connect, Upload, and Download
We are happy to accommodate any tests that you need to run regarding the ability to send and receive data via SFTP. Please reach out to a member of our support team to discuss further.
Note
At Marquette Energy Analytics, we do not perform automatic cleaning or file wiping from the SFTP site. However, it’s essential to consider your usage of the SFTP site. Accumulated data can lead to several challenges, including confusion, clutter, and longer download times. To maintain efficiency, we recommend periodically deleting files that are over a month old.
Our team reserves the right to remove data of any kind from the SFTP site if it is more than a month old and is causing any issues with ongoing MCast performance.
Frequently Asked Questions
If you are using Manual Entry for uploading flow data...
Just navigate to the day(s) that you have updated data for and correct the value. Once you hit "Save", a new forecast will begin generating from the earliest date of new data up through the latest date of data.
How do I handle data in MCast that doesn't reflect my area's actual demand?
Users often find themselves in a situation where the demand of a load area is inaccurately represented in that load area's data. It may be because you issued curtailments to certain customers during a cold event, or a cold event led to stopping delivery to interruptible customers, or system issues led to energy not flowing to some customers. Whatever the case, for any of these interruption events it means that the "true" data point for your load data does not reflect the unimpeded flow of energy into your entire territory.
MCast is a product built to forecast energy demand on your system. It is not meant to represent "true" gas or electricity sendout, but rather it is meant to predict what the sendout would be if all customer needs were met without interruption. Given that, and because our forecasting models tune to the load data you upload over time, when your system experiences interruption events that are reasonably large it is recommended that you clean your data to reflect demand (or, at the very least, predicted demand) in MCast.
To upload or correct the data when one of these events occurs, it's recommended that you follow one of the protocols listed under "Updating daily load data".
If you have questions about the data, the way you're handling a data update in MCast, or anything related to an interruption event, we'd be happy to assist you! Don't hesitate to reach out to our team at support@marquetteenergyanalytics.com
Note
There is no threshold amount at which Marquette Energy Analytics can say you must enter a load correction (in other words, we cannot simply say "any data point that is greater than X% off from the 'true' demand needs to be corrected"). That is why we simply recommend correcting data points when interruption events are "reasonably large."
If you are uncertain if a given interruption event warrants corrections, just reach out to data@marquetteenergyanalytics.com and our data scientists would be happy to let you know what they think!
How do I grab historical forecast data from MCast?
At any given time, MCast contains the load forecast data from the previous three to four years. Those previous forecasts are available to view and download through your MCast website.
- If using the Daily forecasting tool, you can navigate to older day-0 forecast dates by clicking the "Forecast Date" dropdown in the top left of the page, and then clicking a forecast from the "Forecast Timestamp" dropdown directly next to it.
- If using the Hourly forecasting tool, you can view and navigate to older forecasts by clicking the forecast date and timestamp dropdowns found along the top of the page.
If you'd like to evaluate the accuracy of prior forecasts, the best way to do that is by comparing forecasted data to observed data. Your options for gathering the observed data (both for weather observations and load observations) vary, depending on which forecasting product(s) you license.
For those licensing a Daily forecast:
- Use the Performance page of MCast, found under the "Performance" button in the page's header, to utilize built-in tools for understanding the performance of your forecasting models. You may also download the data behind this page using the CSV button found near the data selectors at the top of the page.
- Note that the Performance page is powered by Daily Perfect Weather forecasts, which are a helpful tool in understanding the performance of your forecasting models. Those forecasts are updated automatically, on a once-a-week schedule. For further reading, see "What is 'Perfect Weather'?"
- Use the "Daily Model Performance" file, found in the "DOWNLOADS" tab of the Daily page on MCast, to download a host of data including the load observations, weather observations, load forecasts, and weather forecasts.
For those licensing an Hourly forecast:
- Use the Hourly Performance page of MCast, found under the "Performance" button in the page's header, to utilize built-in tools for understanding the performance of your hourly forecasting models. You may also download the data behind this page using the Downloads and Share options found near the data selectors at the top of the page.
- Note that the Hourly Performance page is powered by Hourly Perfect Weather forecasts. Those forecasts are generated automatically after each hourly forecast completes. For further reading, see "What is 'Perfect Weather'?"
- Use the "Hourly Perfect Weather" file, found in the "DOWNLOADS" tab of the Hourly page on MCast, to download Perfect Weather forecast data directly. For further reading, see "What is 'Perfect Weather'?"
- Use the "Hourly Model Performance" file, found in the "DOWNLOADS" tab of the Hourly page on MCast, to download a host of data including the load observations, weather observations, load forecasts, and weather forecasts.
- Note that this file currently only generates correctly if you are running a forecast once every hour throughout the day. If you do not run at that frequency but want to produce this data for forecast analysis, reach out to our team at support@marquetteenergyanalytics.com
How do I gain access to upload data to MCast?
If you don't have access to upload or modify load data from within the MCast website, then that means you are on a Read-Only account level. To modify data via the user interface, you must be granted either a User account level or an Admin account level by whoever is in charge of account administration at your organization. If you are an admin attempting to grant this access to a user(s), see the Admin Actions & Questions page for more.
If you are seeking access to your company's SFTP site for uploading files to and downloading files from MCast, then you will need login credentials for that SFTP site. Talk to whoever is in charge of account administration at your organization to ascertain the necessary credentials.
If you are seeking access to your company's MCast API for data uploading and downloading, then you will need to authenticate a unique API key for your organization's data to be accessible. A User or Admin account level can generate a key for your API at any time through the "SETTINGS" tab of the website. Talk to whoever is in charge of API key management at your organization to ascertain the necessary authentication.
If you need further assistance, please reach out to our support team at support@marquetteenergyanalytics.com
For further information on user options, see the User Management section of our "Admin Info" page.
What is a Weather Station Optimization study?
As part of onboarding a new customer or area, Marquette Energy Analytics completes a Weather Station Optimization (WSO) study to determine the weather stations that produce the most accurate possible load forecasts. It is done because a geographical area (and the energy needs within that area) very rarely maps directly to a single weather station. There are typically a handful of weather stations in and around an area whose weather data can be used to create an effective forecast.
When performing a WSO, our team runs a variety of modeling scenarios to understand what combination of the weather stations as an input to our forecasting models will yield the most accurate model performance.
Example
If we were performing a WSO on an area called "Metropolis" and there were 3 weather stations (A, B, C) near Metropolis, the results of the WSO might look something like this:
| Weather Station | Percent |
|---|---|
| Station A | 23% |
| Station B | 58% |
| Station C | 19% |
This means that weather data representing the "Metropolis" area at a given time will be equal to:
- ((Station A weather) x 0.23) + ((Station B weather) x 0.58) + ((Station C weather) x 0.19)
This study is a standard first step for most work that Marquette Energy Analytics does, and as such is typically lumped into the costs of purchasing a study or licensing a SaaS product. However, it can also be run independently of other work.
If you are interested in having a WSO performed (or re-performed) on your data, reach out to data@marquetteenergyanalytics.com and we can discuss the details of your request.
If you need to access the weather station weights applied to your MCast instance, you can download them via the downloads menu by selecting Downloads -> Analysis -> Weather Station Weights or by reaching out to support@marquetteenergyanalytics.com and someone will get back to you with the configuration that is currently in place.
Special Cases when it comes to Weather Weighting
If you have reason to use a weather weighting different from what is determined by our WSO, just let us know. We are happy to modify the weights as necessary, and the results of our WSO are in no way binding.
If you have any total areas in your MCast instance, note that WSO studies are not run to produce a total area's weather. Instead, the weather for the total area is calculated using the same formula that calculates the load for that total area
Example
If I have a Total area called "Total City" and it is comprised of 2 areas, "Metropolis" (which is weighted as half of the Total City) and "Smallville"(which is weighted as half of Total City), then
- the load representing Total City will be (Metropolis + Smallville)
- and the weather representing Total City will be ((Metropolis weather) x 0.5) + ((Smallville weather) x 0.5)
For further information on user options, see the User Management section of our "Admin Info" page.
I am interested in switching to license weather data through Marquette Energy Analytics' preferred vendor. What may be some implications of that change to the weather we are sourcing?
If you decide to switch your weather source to AccuWeather for Business via Marquette Energy Analytics' partnership with them, here are the main implications
- Licensing costs: Our partnership with AccuWeather for Business allows us to source the data for you at a discounted rate. Your weather licensing costs would also be tacked onto your normal MCast licensing quote, so you can pay it all together. Our team would be happy to generate a quote for you to see what the additional cost of your weather data licensing would come out to!
- Weather Data in MCast: Upon switching to AccuWeather or Business, we would shift your instance of MCast to source data from AccuWeather using their XML Query Tool, an API that allows us to ensure the most efficient data transfers and the fastest forecasting possible.
- Weather Data for other uses: All of the AccuWeather for Business data could be automatically output from MCast, via either file uploads to your SFTP site or calls to our MCast API. If you’re interested in alternatives, we’d be happy to discuss other data access possibilities as well (such as setting you up with a connection to an SFTP site hosting weather data alone).
If you wish to discuss this further or have more questions, reach out to support@marquetteenergyanalytics.com!
Our data retention policy
Marquette Energy Analytics is proud to provide easy access to previous forecast data. Using the MCast website or API, you will always be able to access data from at least 3 years prior to today's date. However, due to data storage and infrastructure requirements, we cannot guarantee maintenance of all historical MCast forecasts. We actively encourage our customers to save off any forecasting data that they may want available for future access.
Marquette Energy Analytics reserves the right to clear any forecasting data from our servers with no notice to the customer if the data in question was generated three or more years ago.